
We must import the matplotlib package using Pycharm package manager. The process is described in the section 12.2.0. Pyplot plots the graph, and numpy holds the variables.
# import matplotlib to plot graphs

        import matplotlib.pyplot as plt

        import numpy as np

        days = [1,3,5,6,8,]

        temp = [37,34,37,35,34]

        plt.plot(days, temp)

        plt.show()
The plot can be seen below. You can make the plot much fancier depending on your needs. There are many examples on the internet.

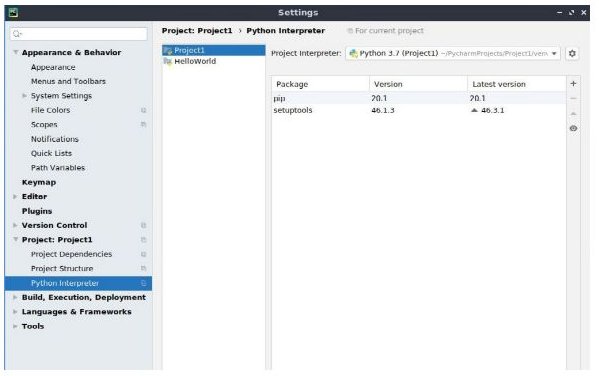
Press Ctrl → Alt → s in the PyCharm window. The Settings window will open. Under Project select Python Interpreter.
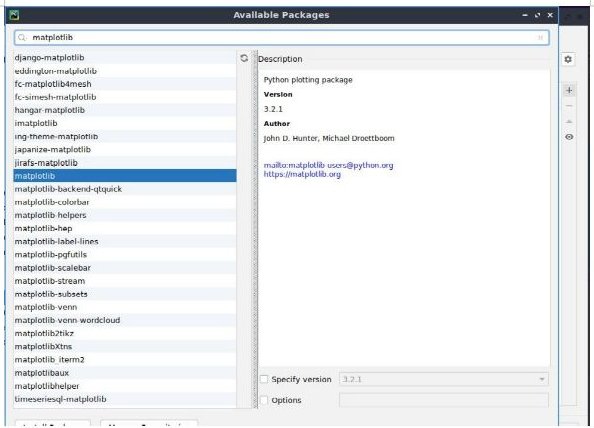
Click the plus sign (+) on the right. A new window will appear with the available packages. Type matplotlib next to the search icon. Be sure matplotlib is highlighted, and click Install Package.
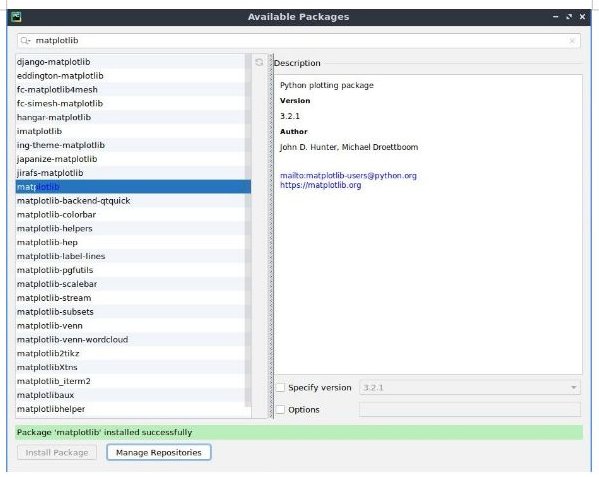
You will see the following screen saying Package ‘matplotlib’ installed successfully. You can close the open windows, the package is installed.
There are several reasons why a package doesn't install correctly. The simplest thing to try is uninstalling the matplotlib package, and reinstalling the package with a lower version number.
Occasionally the program will hang for no reason. Use run->debug to view the plots.
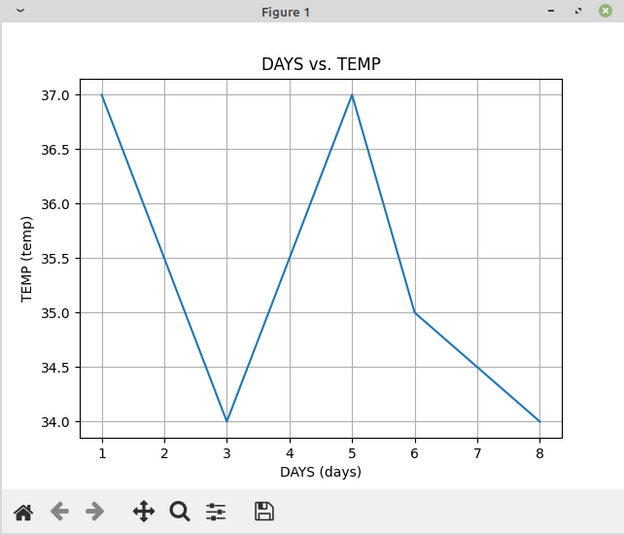
The following example graph is the same as above, except we have added axis information.
  import matplotlib.pyplot as plt

  import numpy as np

  days = [1,3,5,6,8,]

  temp = [37,34,37,35,34]


  fig, ax = plt.subplots()

  ax.plot(days, temp)

  ax.set(xlabel='DAYS (days)', ylabel='TEMP (temp)',
          title='DAYS vs. TEMP')

  ax.grid()


  plt.show()
SALARSEN.COM
Table of Contents
Ch1-Install Python
Ch2-Install PyCharm
Ch3-Save Work
Ch4-Add Project
Ch5-Variables
Ch6-Print&Input
Ch7-Lists
Ch8-Loops
Ch9-If&Logical
Ch10-Functions
Ch11-Bubble Sort
Ch12-Plotting
Ch13-Files
Ch14-Print Format
Ch15-Dict&Comp&Zip
Ch16-Arrays
Ch17-Electrical
Ch18-Regression
Ch19-Differential
Ch20-Secant
