
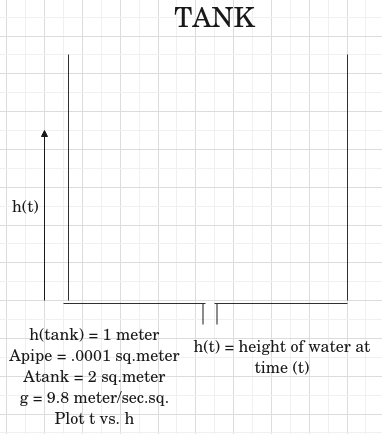
If water drains from a tank, the flow will be greatest at first. As the level in the tank decreases, the water pressure decreases, and the flow out of the tank will decrease. Using Torricelli’s principle we can find the time for the tank to drain to any height h(t). Plot t vs h. The equation is below.
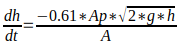
We will solve the first order differential equation dh/dt=(-0.61*Ap*(2*g*h)**.5)/A, where h0=1. We can solve a first order differential equation that is continuous over an interval, by integrating. Python can be used to find a solution.
We will import scipy, numpy, and matplotlib modules, which are probably already installed if you completed previous chapters. Otherwise see Chapter 12 for installation procedures with PyCharm.
We start with defining a Python function called the model, with arguments h, and t. After the function is called, the function returns the expression -k*(h**.5)), where k = (0.61*Ap*(2*g)**.5)/A (These equations are 19.3.0, after some algebra.)
def model(h,t):

         A = 2

         Ap= .0001

          g = 9.81

         k = (0.61*Ap*(2*g)**.5)/A

         return -k*(h**.5)
The next line sets h0 = 1 meter as given in the initial conditions. The next line defines the t values on the interval as 0 to 10000, divided into 10 intervals.
h0 = 1

        t= np.linspace(0.,10000,10)
We then integrate the ordinary differential equation with:
hf = odeint(model,h0,t)
Finally we plot the results. The entire program follows. (Sometimes the plots do not display until Run→Debug is used.)
from scipy.integrate import odeint

          import numpy as np

          from matplotlib import pyplot as plt

          def model(h,t):

               A = 2

               Ap= .0001

               g = 9.81

              k = (0.61*Ap*(2*g)**.5)/A

                return -k*(h**.5)

          h0=1

          t= np.linspace(0.,10000,10)

          hf = odeint(model,h0,t)

          print(t)

          print(hf)


          plt.plot(t,hf,'-')   #Plots a curve

          plt.plot(t,hf,'ro')    #Plot data points as red circles

          plt.xlabel('t (seconds)')

          plt.ylabel('h (meters)')

          plt.title('Tank Problem')

          plt.show()
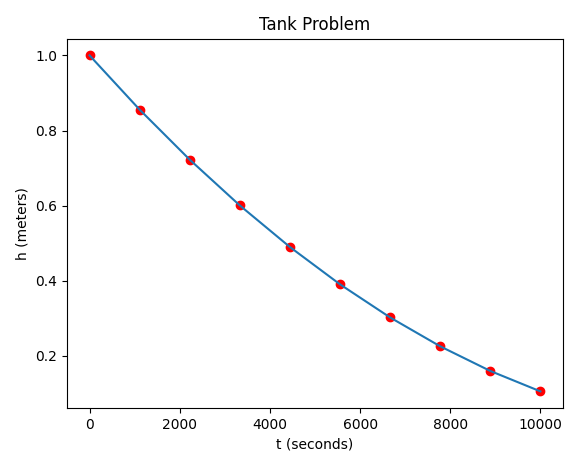
You can see it will take a little over 2 ½ hours (10000 seconds) for the tank to nearly empty.
SALARSEN.COM
Table of Contents
Ch1-Install Python
Ch2-Install PyCharm
Ch3-Save Work
Ch4-Add Project
Ch5-Variables
Ch6-Print&Input
Ch7-Lists
Ch8-Loops
Ch9-If&Logical
Ch10-Functions
Ch11-Bubble Sort
Ch12-Plotting
Ch13-Files
Ch14-Print Format
Ch15-Dict&Comp&Zip
Ch16-Arrays
Ch17-Electrical
Ch18-Regression
Ch19-Differential
Ch20-Secant
